Hack Day Project: UK Box Office Graphs
Last weekend I started a little side project visualizing the UK box office. I was at Culture Hack Day and the UK Film Council had provided some cool data to play around. It contained info on movie screenings over the UK, not only “real” cinemas, but also screenings held in universities, galleries, etc. And it would have screening times, ticket prices, geolocation and more cool stuff. Only… that data wasn’t actually completely available yet. So instead I started looking at the box office data from the UK Film Council site , and whether or not I could do something with that. Eventually I want to use that advanced data though and merge that into what I’ve created now.
I started off with a ‘simple’ overview of 2010 (see here for the actual version ):
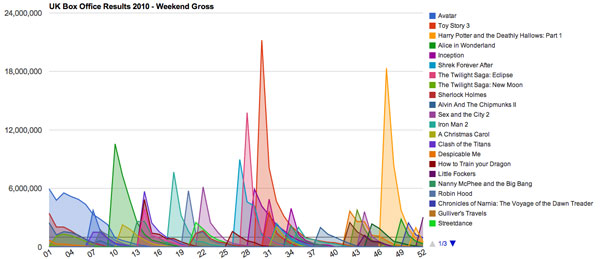
It shows the weekend gross per weekend for the 50 highest grossing movies of 2010. It’s interesting to see how well some movies perform in comparison to others. I also made a larger version with 100 movies where you see in a bit more detail how the movies are doing.
I then had a look at the highest grossing movies of 2010 (see the full version here ):
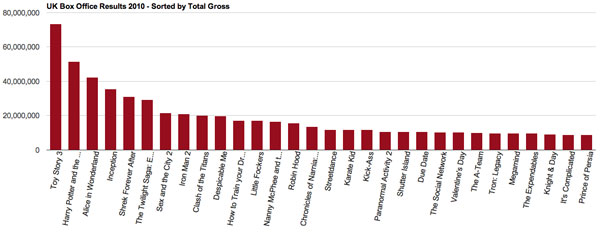
Not much surprise there, although it’s a bit depressing to see how much money bad movies can make (Twilight, Clash of the Titans, Valentine’s Day…).
The next step was making a similar graph as the first one, but only for the last couple of weeks (see here for the full version ):
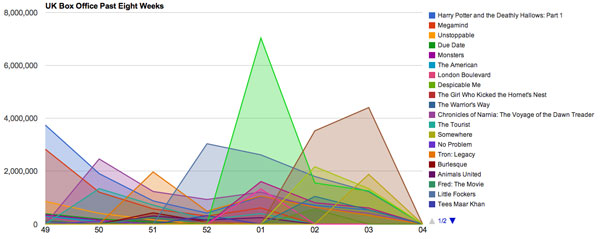
The current week is still missing (waiting for the UKFC to update their website), but it’s great to see the jump The King’s Speech made last week.
Finally I made charts for every week I had, showing the percentage of the box office each movie took (see the full version her e):
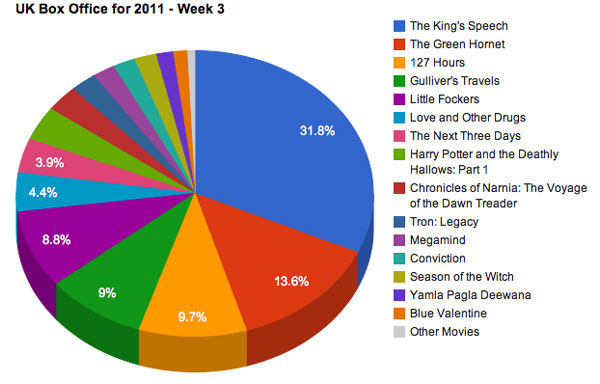
I really like these and the different patterns you discover. Like Valentine’s Day was the highest grossing movie in the week of Valentine’s Day , but only by 2% (with Avatar beating it the next week).
This is only the first step in this project; I really want to do more with the data I have. The next things I’m focusing on are making the graphs embeddable, adding notes and interesting dates to each graph (like when bank holidays were, or important events that might influence movie-goers etc), grabbing more data about the movies (like director, actors, writer, etc) and being able to show that data when you click on a movie.
I’d love to hear though what you all think of the graphs, and what type of stuff you’d like to see. It’s been fun working on this and I’m hoping I can do more with it!